Linear Regression intuition
Linear regression is pretty simple. The idea is that if we have measurements, we will draw a line through them. This enables us to use this line to predict values, for example.
Imagine you want to move. You are currently looking for an apartment and do not know how much your new apartment will cost you. However, you don’t just want to move into the apartment with the lowest rent, but you have demands – especially on the living space. It should be at least 60 square meters. On the Internet you can look at some apartments including living space and rent. You already know from experience that larger apartments are more expensive than smaller ones. To check the statement, record the rent and square meters of each apartment. You will see the following.
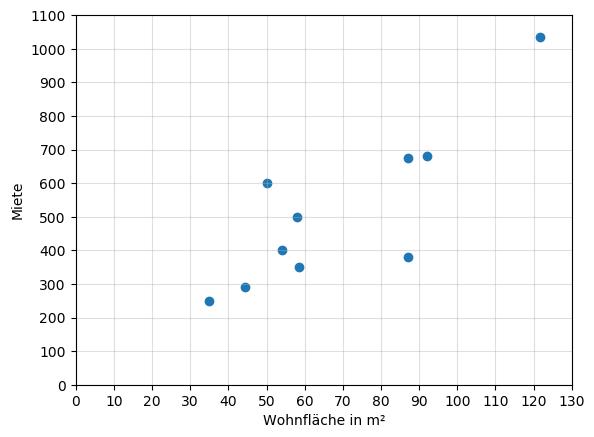
Some of the apartments cost the same, but differ enormously in the living space. You want to find a uniform rule that allows you to estimate exactly how much you have to spend on a 60m² apartment. And this is exactly where linear regression helps you.
Linear regression is a statistical process that is used to lay a straight line through the data in such a way that it best represents the data. This is exactly the case when the sum of the squared distances between the straight line and the data is smallest. With this estimator you get a function with which you can determine the value of the dependent variable (rent) for each value of an independent variable (living space).

The straight line is defined by the equation y = a + b * x. The rent in the example is represented by the target variable y. Our goal is to calculate y for any number of square meters. We do this with the help of the independent variable x, the intercept a and the slope coefficient b. The intercept is the value of y at which the straight line intersects the vertical axis. In our example, that would theoretically be the rent you would have to pay for an apartment with 0 square meters. The coefficient b is the value with which the target value increases when the independent variable is increased by 1.
Read Python files and draw graphics
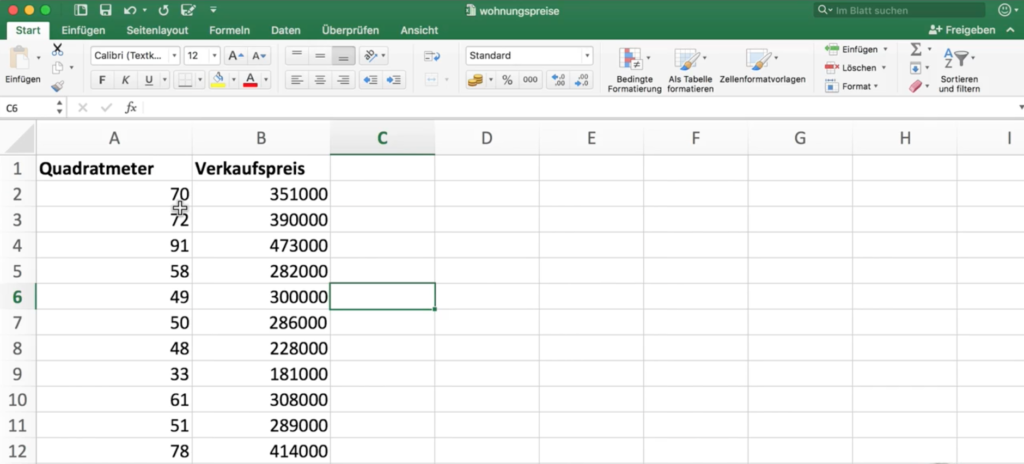
Here we have already opened the apartment price file in Excel.
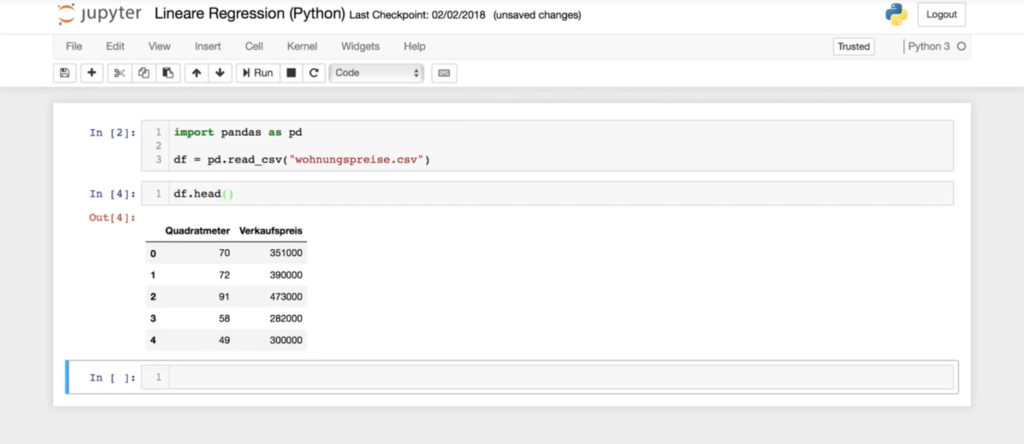
Now go over to Python and create a new Notebook. Here we load the Pandas library so that we can read this data frame or this .csv file.
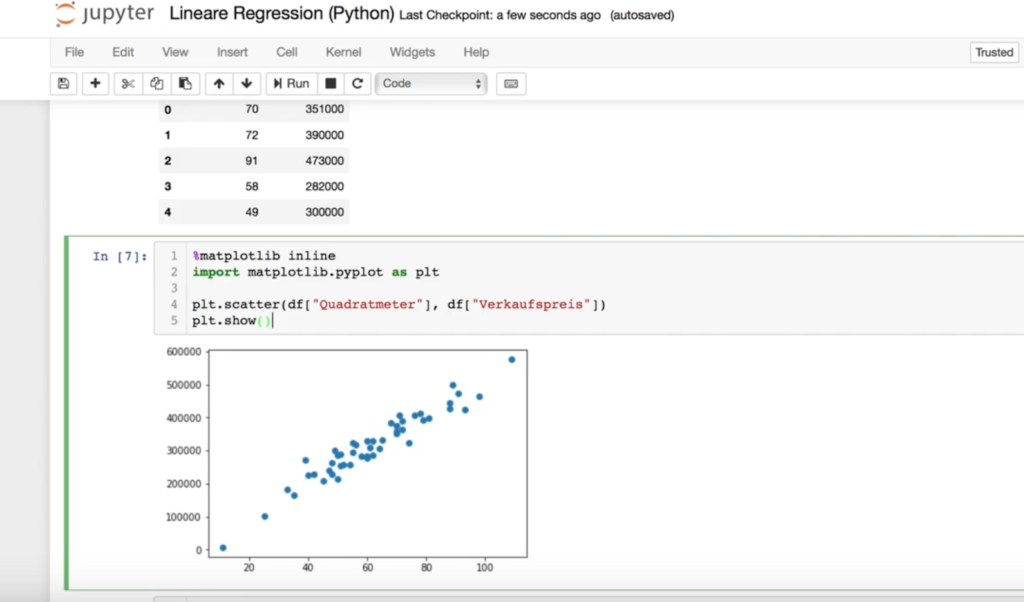
To draw the graphic we have to define the axes and for this we need the matplotlib package.
Python Lineare Regression
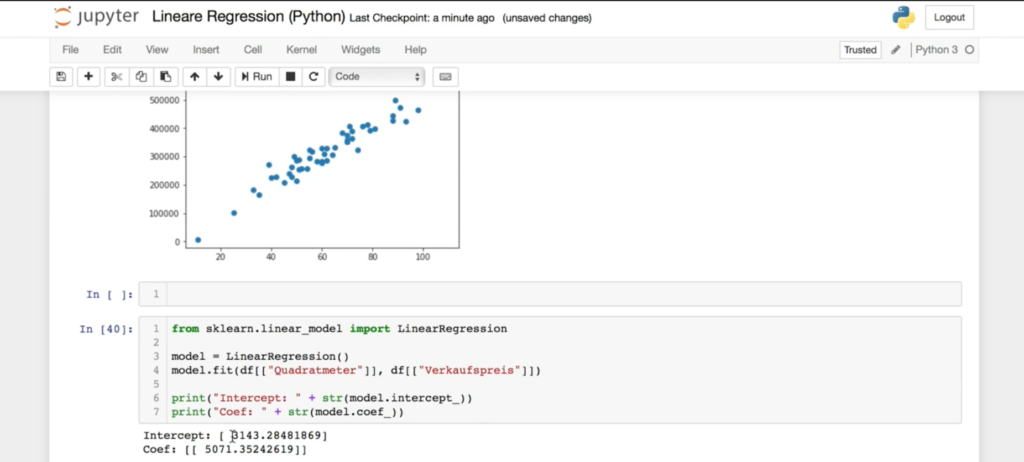
Now we are building a model with linear regression and the tool that we use machine learning in Python is called scikit-learn.
This tool provides us with a lot of different things for machine learning and we can import that. The package name is sklearn.
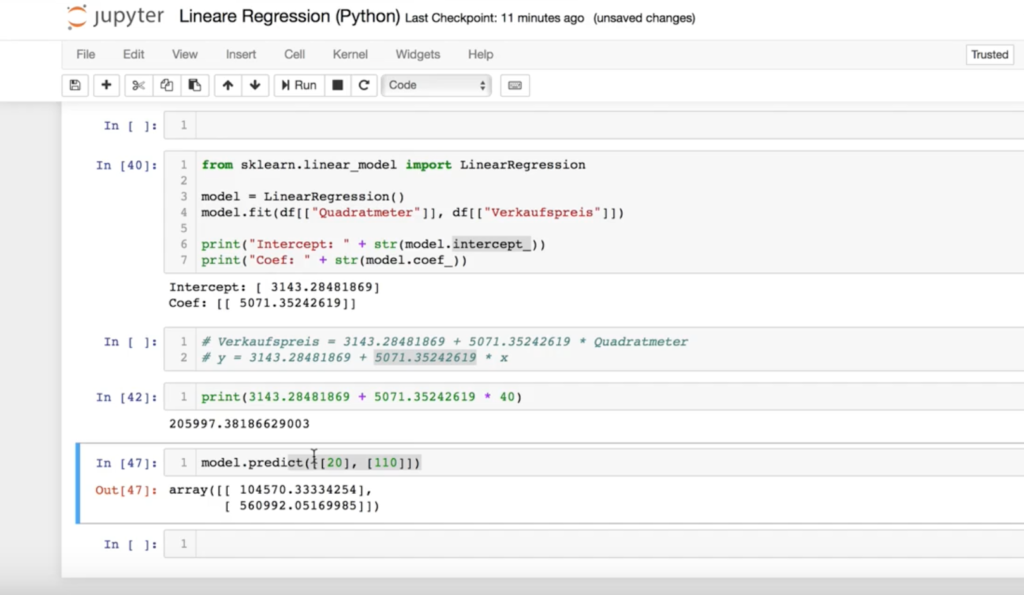
With the following function, the system can determine the selling price of an apartment which is, for example, 20m2 and 110m2.
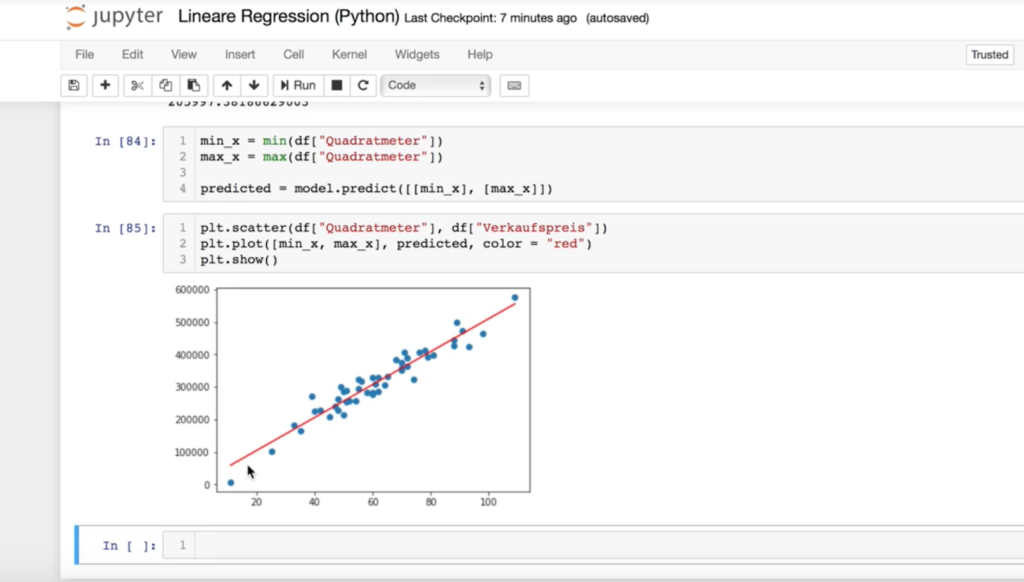
We need the values to draw a diagram.
Next page